MA213 Basic Statistics and Probability - Lab1 Guide
Lab 1: Introduction to R
In this lab session, we will learn basic syntax of R.
Learning Objectives
- Use R for Data Management and Exploration: Utilize R to load, pre-process, and explore data through visualization and summarization techniques.
Install R and RStudio.
You can download and install R from
And you can download and install RStudio from
https://posit.co/download/rstudio-desktop/
We assume that you have already installed R and Rstudio (You need to install first R and then install Rstudio because Rstudio is an IDE for R).
Introduction of R
R is Programming language and environment statistical computing, data manipulation and graphical display.
R is free and open source.
Rstudio is also free and open source IDE (Integrated Development Environment) for R.
Brief walk through about RStudio interface
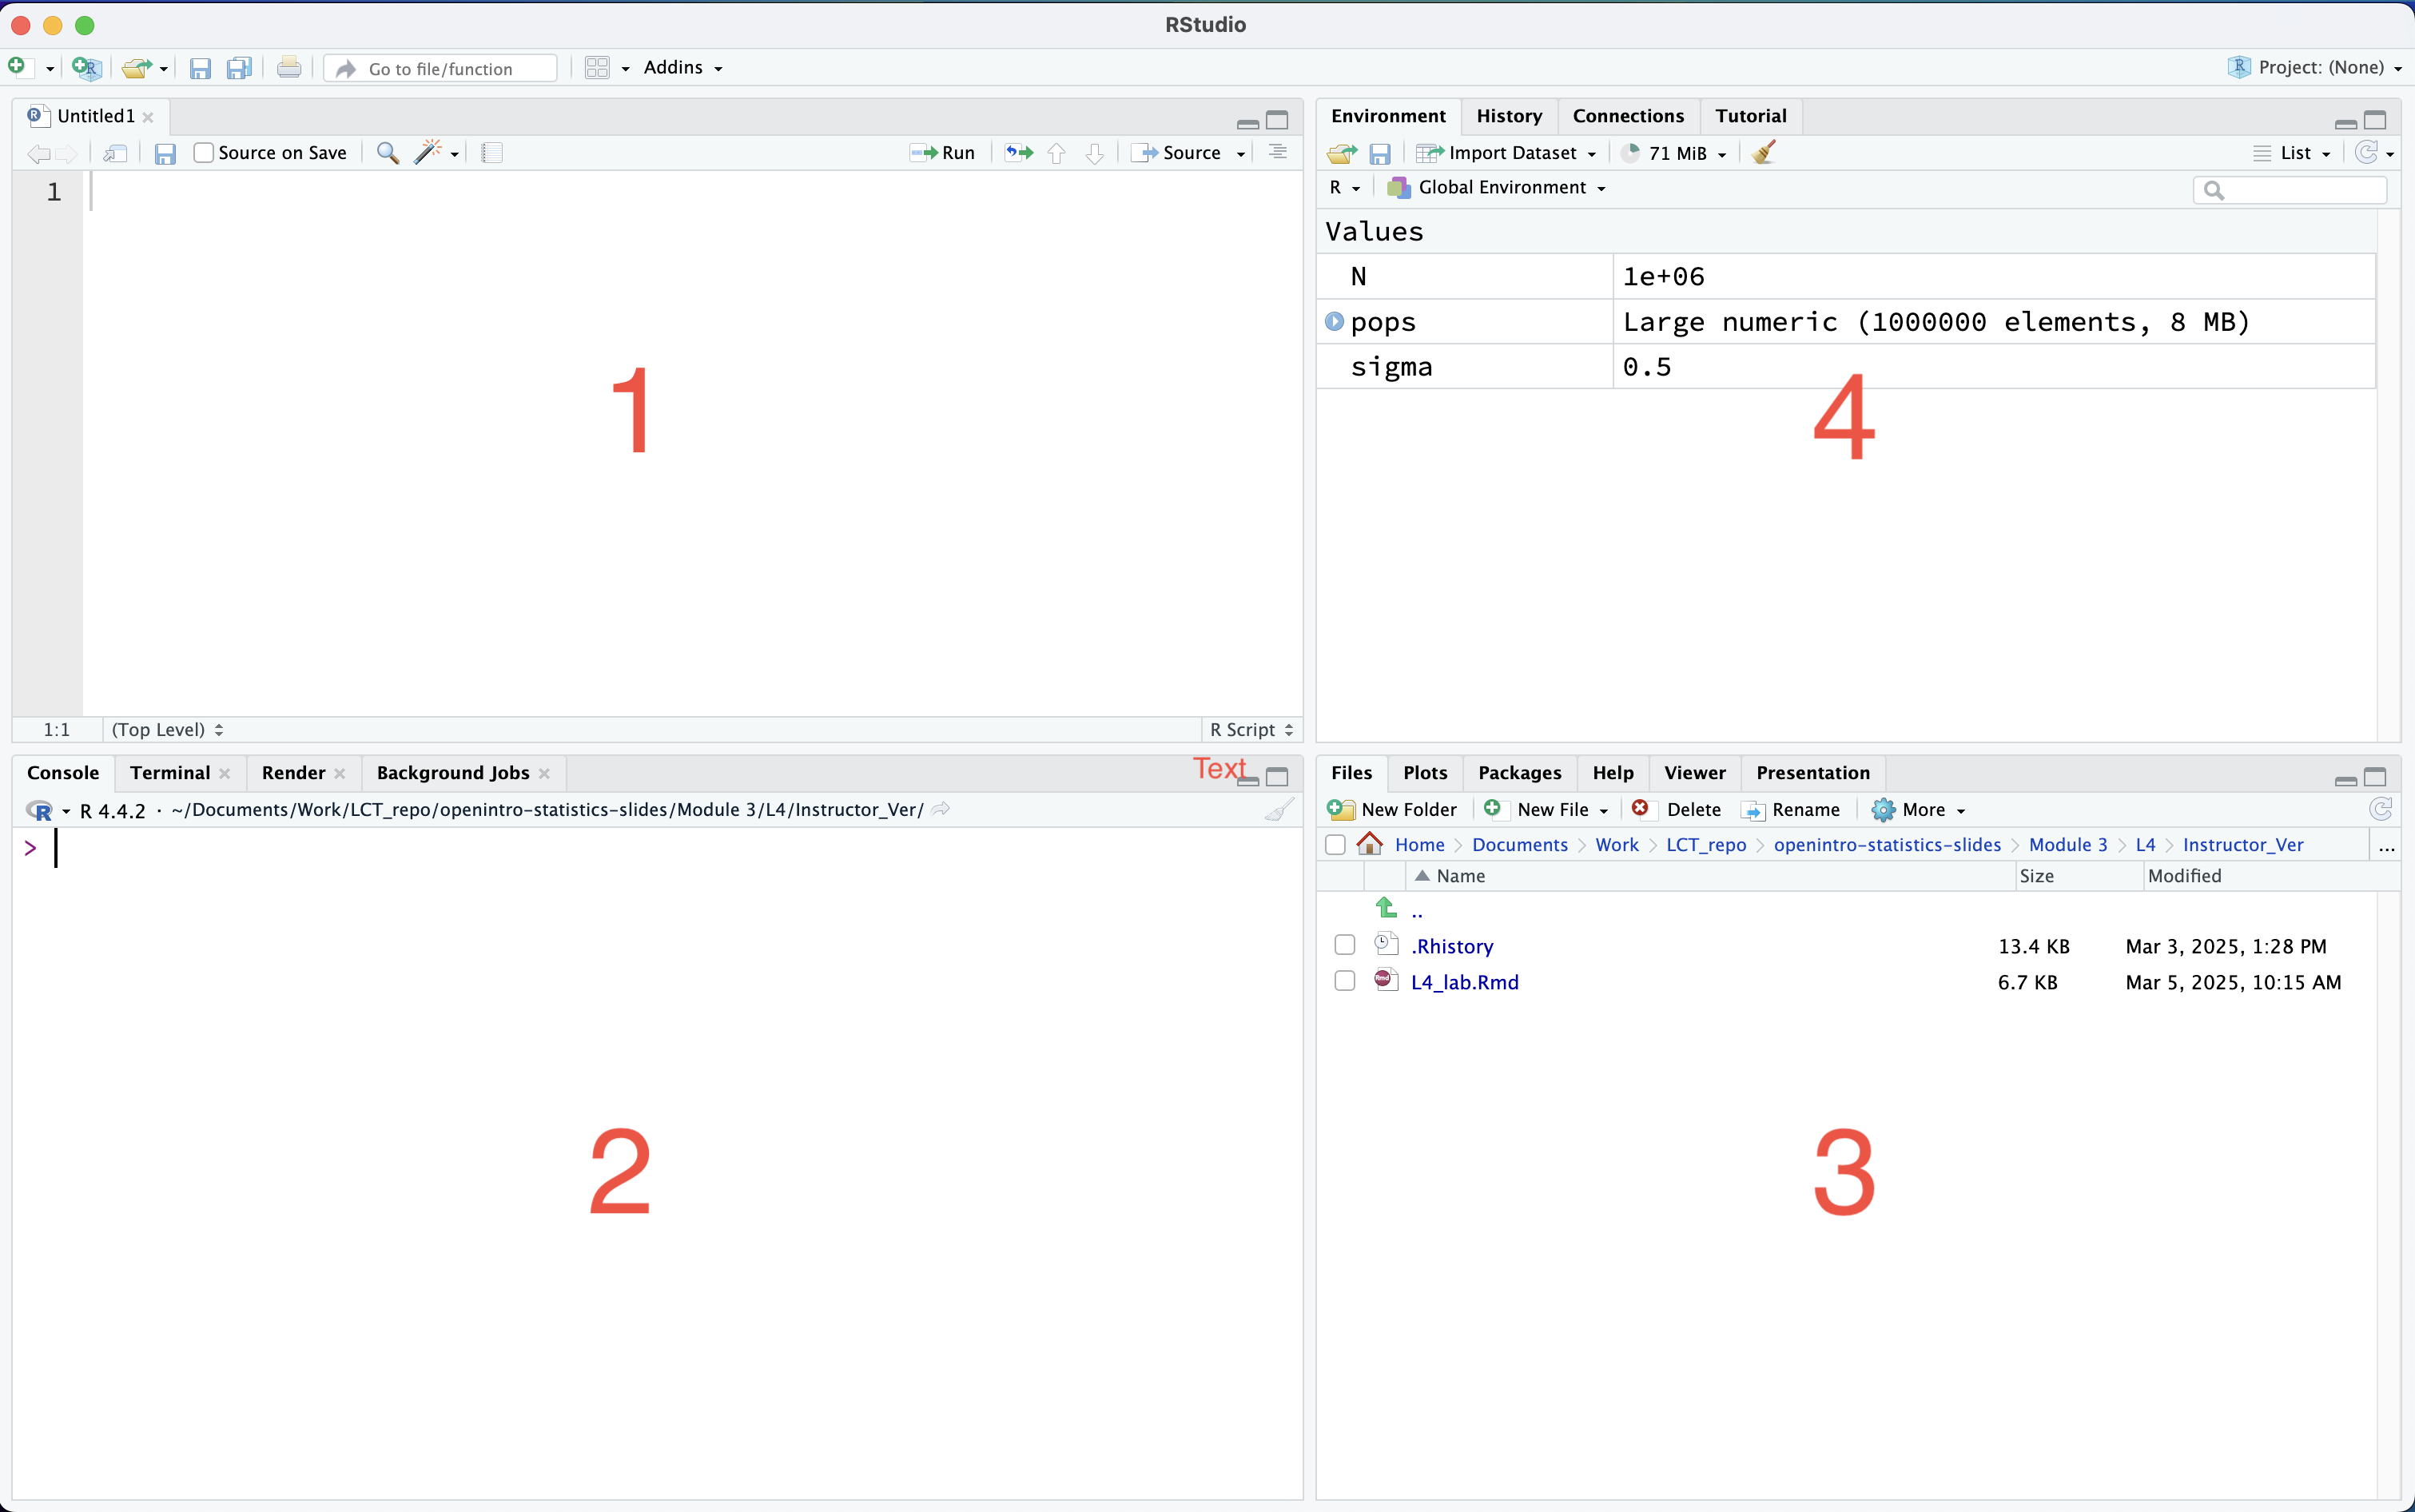
window 1 : script window (text editor)
window 2 : console window (this is where you type your R
code and run)
window 3 : plots, files, packages, help… window
window 4 : environment window
Set up working directory
You can go to
Session→set working directory→choose directoryand then choose your working directory.or
You can go to
Filestap → ☸︎ →‘copy folder path to Clipboard’then paste into
setwd()function
or
- You can go to
Filestap → ☸︎ →‘Set As Working Directory’
How to run code?
Directly type your command in the console window.
You can run your R chunk by pressing run button
▶in the R chunk in your R markdown file.You can write your commands on your R script file and highlight the commands and press
run
Run shortcut : `ctrl` + `enter` (windows) or `cmd` + `enter` (mac).R is basically a big calculator (some mathematics) : basic math operations to matrix operations
- Basic math operations
+: add
-: substract
*: multiply
/: divide
^or**: exponent
For example
\((\frac{12}{24})^2\)
(12/24)^(2)## [1] 0.25#or
(12/24)**(2)## [1] 0.25Assign values to a variable
Let’s say if you want to save 10 to variable A. You can
do the following command.
A <- 10
A <<- 10
10 -> A
10 ->> A
A = 10

# A <- 10
# A = 10
# commonly used ones
And you can check what value the variable A has by
calling it or using print() function
A## [1] 10print(A)## [1] 10Assigning character type information to a variable
SchoolName <- "Boston University"
SchoolName
## [1] "Boston University"Assign values to a vector
You can assign multiple values to a vector.
GPA <- c(3.2, 3.7, 3.9, 2.3, 2.7)
FirstName <- c("Tom", "Sarah", "Nick", "Amy", "John")
GPA
## [1] 3.2 3.7 3.9 2.3 2.7FirstName## [1] "Tom" "Sarah" "Nick" "Amy" "John"There are some useful functions for a vector
seq(from=a, to=b, by=c): this generates a sequence vector from value a to b by c increment.rep(x, times = n): this replicate elementxfor n times.length(x): this will give you the length of vectorx
Examples
my_vector = seq(1, 10, 2)
my_vector
## [1] 1 3 5 7 9another_vector = 1:10
another_vector## [1] 1 2 3 4 5 6 7 8 9 10vector3 = rep("BU", 25)
vector3## [1] "BU" "BU" "BU" "BU" "BU" "BU" "BU" "BU" "BU" "BU" "BU" "BU" "BU" "BU" "BU"
## [16] "BU" "BU" "BU" "BU" "BU" "BU" "BU" "BU" "BU" "BU"Accessing vector elements
Each element in a vector is associated with index number. The index in R starts from 1 as the first item.
For example,
#
SomeNames <- c("Alpha", "Bravo", "Charlie")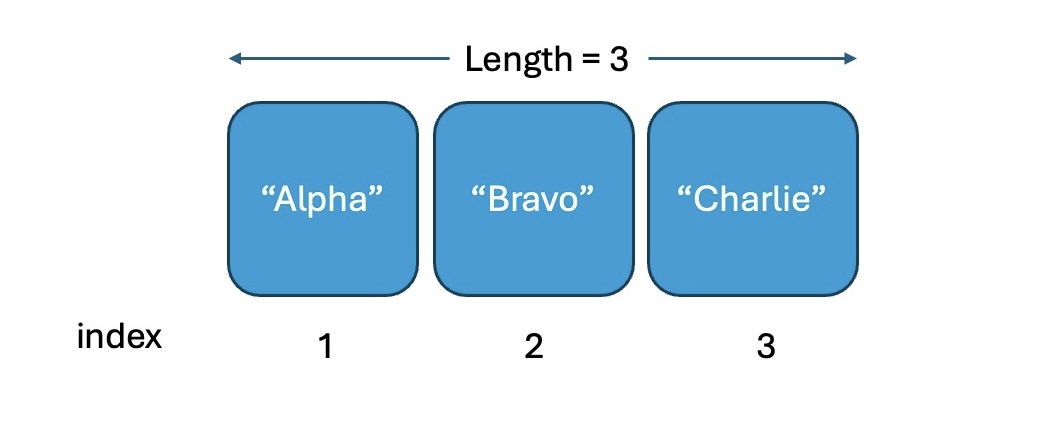
For example
You can access the third element of SomeNames by
SomeNames[3] .
You can also access, for example, the second and the third elements
by SomeNames[2:3] .
#
SomeNames[3]
## [1] "Charlie"SomeNames[2:3]## [1] "Bravo" "Charlie"Numeric vector can be subsetted using condition
x[condition]the conditional statements (condition) you can use could be
x == 20    # x equals to 20
x < 100
x <= 100
x > 100
x >= 100
x != 100   # x not equal to 100
For example
Numbers <- c(20, 30, 50, 70, 120, 200)
Numbers[Numbers<100]
## [1] 20 30 50 70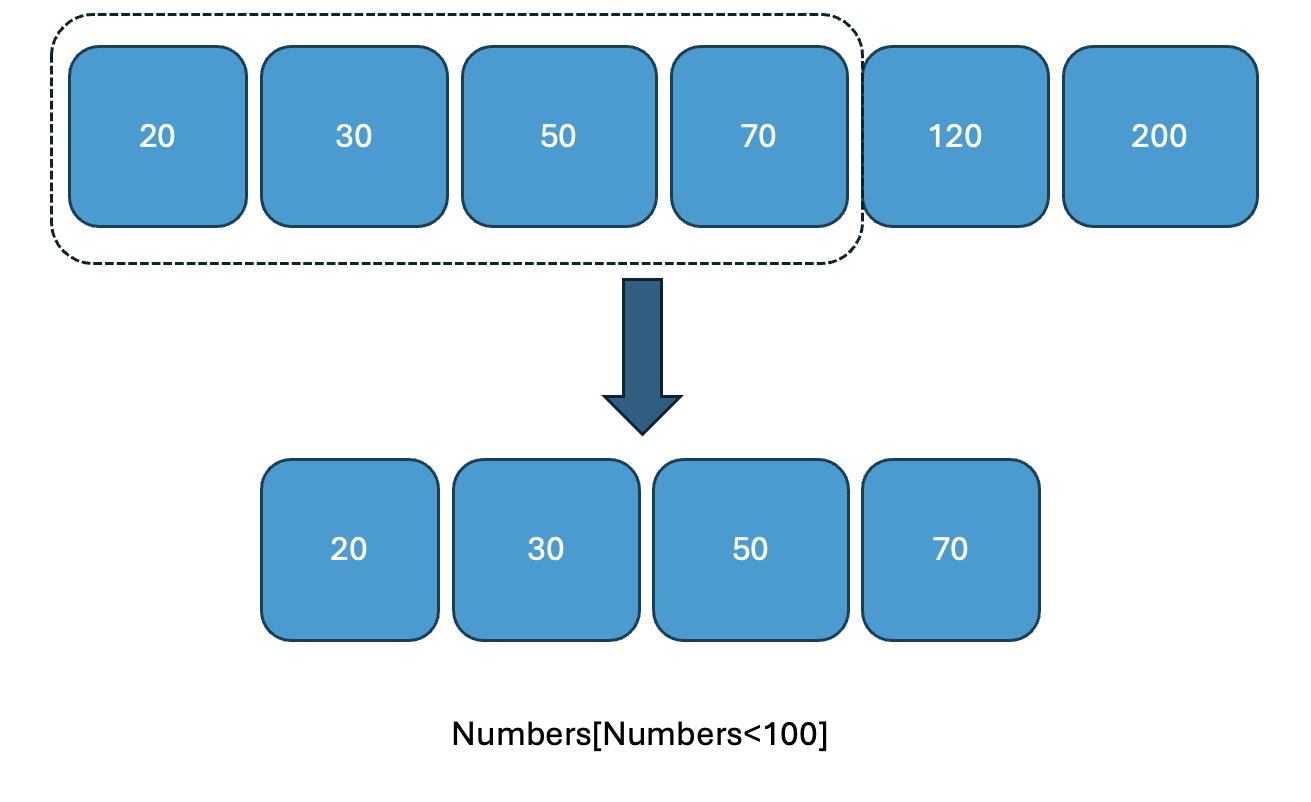
Importing and Subsetting Data
You can import Data by using read.table() function.
my_data <- read.csv("lab1/data/mtcars.csv")
# to be able to import this file, this file needs to be in your working directory
You can access subset data
Specific element by
my_data[row, column]- | for example, the element in the third row and the fourth column
my_data[3,4]
- | for example, the element in the third row and the fourth column
Specific row by
my_data[row,]- | for example, all the element of the third row
my_data[3,]
- | for example, all the element of the third row
Also,
Specific column by
my_data[,column]- | for example, all the element of the fifth column
my_data[,5]
- | for example, all the element of the fifth column
Access the column by using
$sign such asmy_data$column_name- | for example,
hpcolumn frommy_dataismy_data$hp
- | for example,
Conditional statement works similar as vectors (row wise and column wise)
- | for example,
my_data[my_data$hp<100,]
- | for example,
Multiple conditions can be combined
You can combine multiple logical conditions using & (AND), | (OR), and ! (NOT) operators inside the row index to filter rows. For example
- Rows where
hpis less than 100 ANDcylequals 4:
my_data[(my_data$hp < 100) & (my_data$cyl == 4), ]## X mpg cyl disp hp drat wt qsec vs am gear carb
## 3 Datsun 710 22.8 4 108.0 93 3.85 2.320 18.61 1 1 4 1
## 8 Merc 240D 24.4 4 146.7 62 3.69 3.190 20.00 1 0 4 2
## 9 Merc 230 22.8 4 140.8 95 3.92 3.150 22.90 1 0 4 2
## 18 Fiat 128 32.4 4 78.7 66 4.08 2.200 19.47 1 1 4 1
## 19 Honda Civic 30.4 4 75.7 52 4.93 1.615 18.52 1 1 4 2
## 20 Toyota Corolla 33.9 4 71.1 65 4.22 1.835 19.90 1 1 4 1
## 21 Toyota Corona 21.5 4 120.1 97 3.70 2.465 20.01 1 0 3 1
## 26 Fiat X1-9 27.3 4 79.0 66 4.08 1.935 18.90 1 1 4 1
## 27 Porsche 914-2 26.0 4 120.3 91 4.43 2.140 16.70 0 1 5 2- Rows where
hpis less than 100 ORcylequals 4:
my_data[my_data$hp < 100 | my_data$cyl == 4, ]## X mpg cyl disp hp drat wt qsec vs am gear carb
## 3 Datsun 710 22.8 4 108.0 93 3.85 2.320 18.61 1 1 4 1
## 8 Merc 240D 24.4 4 146.7 62 3.69 3.190 20.00 1 0 4 2
## 9 Merc 230 22.8 4 140.8 95 3.92 3.150 22.90 1 0 4 2
## 18 Fiat 128 32.4 4 78.7 66 4.08 2.200 19.47 1 1 4 1
## 19 Honda Civic 30.4 4 75.7 52 4.93 1.615 18.52 1 1 4 2
## 20 Toyota Corolla 33.9 4 71.1 65 4.22 1.835 19.90 1 1 4 1
## 21 Toyota Corona 21.5 4 120.1 97 3.70 2.465 20.01 1 0 3 1
## 26 Fiat X1-9 27.3 4 79.0 66 4.08 1.935 18.90 1 1 4 1
## 27 Porsche 914-2 26.0 4 120.3 91 4.43 2.140 16.70 0 1 5 2
## 28 Lotus Europa 30.4 4 95.1 113 3.77 1.513 16.90 1 1 5 2
## 32 Volvo 142E 21.4 4 121.0 109 4.11 2.780 18.60 1 1 4 2Rows where hp is NOT less than 100:
my_data[! (my_data$hp < 100), ]## X mpg cyl disp hp drat wt qsec vs am gear carb
## 1 Mazda RX4 21.0 6 160.0 110 3.90 2.620 16.46 0 1 4 4
## 2 Mazda RX4 Wag 21.0 6 160.0 110 3.90 2.875 17.02 0 1 4 4
## 4 Hornet 4 Drive 21.4 6 258.0 110 3.08 3.215 19.44 1 0 3 1
## 5 Hornet Sportabout 18.7 8 360.0 175 3.15 3.440 17.02 0 0 3 2
## 6 Valiant 18.1 6 225.0 105 2.76 3.460 20.22 1 0 3 1
## 7 Duster 360 14.3 8 360.0 245 3.21 3.570 15.84 0 0 3 4
## 10 Merc 280 19.2 6 167.6 123 3.92 3.440 18.30 1 0 4 4
## 11 Merc 280C 17.8 6 167.6 123 3.92 3.440 18.90 1 0 4 4
## 12 Merc 450SE 16.4 8 275.8 180 3.07 4.070 17.40 0 0 3 3
## 13 Merc 450SL 17.3 8 275.8 180 3.07 3.730 17.60 0 0 3 3
## 14 Merc 450SLC 15.2 8 275.8 180 3.07 3.780 18.00 0 0 3 3
## 15 Cadillac Fleetwood 10.4 8 472.0 205 2.93 5.250 17.98 0 0 3 4
## 16 Lincoln Continental 10.4 8 460.0 215 3.00 5.424 17.82 0 0 3 4
## 17 Chrysler Imperial 14.7 8 440.0 230 3.23 5.345 17.42 0 0 3 4
## 22 Dodge Challenger 15.5 8 318.0 150 2.76 3.520 16.87 0 0 3 2
## 23 AMC Javelin 15.2 8 304.0 150 3.15 3.435 17.30 0 0 3 2
## 24 Camaro Z28 13.3 8 350.0 245 3.73 3.840 15.41 0 0 3 4
## 25 Pontiac Firebird 19.2 8 400.0 175 3.08 3.845 17.05 0 0 3 2
## 28 Lotus Europa 30.4 4 95.1 113 3.77 1.513 16.90 1 1 5 2
## 29 Ford Pantera L 15.8 8 351.0 264 4.22 3.170 14.50 0 1 5 4
## 30 Ferrari Dino 19.7 6 145.0 175 3.62 2.770 15.50 0 1 5 6
## 31 Maserati Bora 15.0 8 301.0 335 3.54 3.570 14.60 0 1 5 8
## 32 Volvo 142E 21.4 4 121.0 109 4.11 2.780 18.60 1 1 4 2If an expression or condition is True or False, programming language
gives two answers TRUE or FALSE . It is
sometimes can be shown to 1 or 0.
3==3 # True## [1] TRUE10 == 3 # False## [1] FALSEmy_data$hp < 100 # if the horse power of the car is less than 100 it gives 1, 0 otherwise. ## [1] FALSE FALSE TRUE FALSE FALSE FALSE FALSE TRUE TRUE FALSE FALSE FALSE
## [13] FALSE FALSE FALSE FALSE FALSE TRUE TRUE TRUE TRUE FALSE FALSE FALSE
## [25] FALSE TRUE TRUE FALSE FALSE FALSE FALSE FALSEmy_data[my_data$hp < 100,] # this is how we are only printing the cars data with horse power < 100. ## X mpg cyl disp hp drat wt qsec vs am gear carb
## 3 Datsun 710 22.8 4 108.0 93 3.85 2.320 18.61 1 1 4 1
## 8 Merc 240D 24.4 4 146.7 62 3.69 3.190 20.00 1 0 4 2
## 9 Merc 230 22.8 4 140.8 95 3.92 3.150 22.90 1 0 4 2
## 18 Fiat 128 32.4 4 78.7 66 4.08 2.200 19.47 1 1 4 1
## 19 Honda Civic 30.4 4 75.7 52 4.93 1.615 18.52 1 1 4 2
## 20 Toyota Corolla 33.9 4 71.1 65 4.22 1.835 19.90 1 1 4 1
## 21 Toyota Corona 21.5 4 120.1 97 3.70 2.465 20.01 1 0 3 1
## 26 Fiat X1-9 27.3 4 79.0 66 4.08 1.935 18.90 1 1 4 1
## 27 Porsche 914-2 26.0 4 120.3 91 4.43 2.140 16.70 0 1 5 2